Trends in human evolution research
Tegan Foister asked me one day if we could analyze human evolution via text mining. As a test case I did topic modeling and sentiment analysis on research articles published in the Journal of Human Evolution over the last 50 years. The analysis covered 4014 articles.
This post is about the results. I made a separate post where I put technical instructions on how to do such analysis. The code is available on GitHub.
What words?
First I looked at the frequencies of words. Commonly, very frequent and very rate words are removed from text mining, since usually they are not informative. The words human and evolution would appear in every article simply because they are in the title of the journal. Articles and propositions are typically removed at an early stage as well, since they do not associate with textual content. Punctuation is also usually removed for similar reasons. Sometimes punctuation or articles can carry interesting signals on their own, but for this analysis I just removed them.
For starters, I visualized the most frequent and the rarest words across all the articles. strictly speaking not the most frequent, but almost. I set the upper threshold for the words to occur at 99% of the articles, and the lower threshold at 1%. Here is what came up.
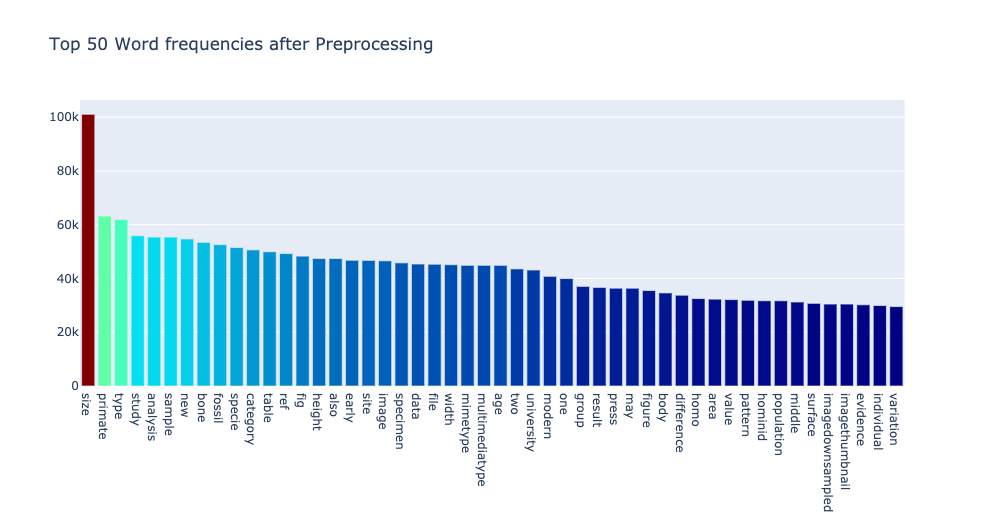
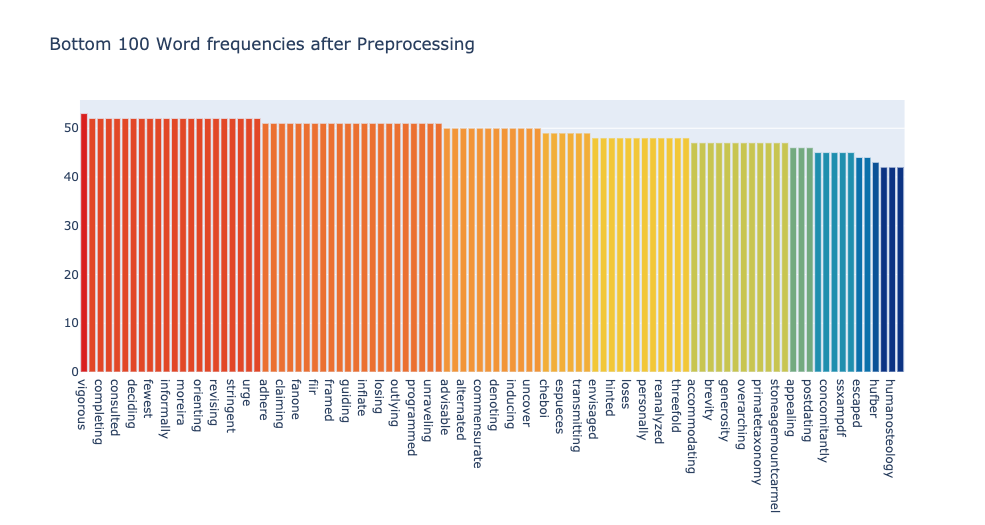
From visual inspection, the cutoffs do not look good enough for analysis. The top words are too generic and too methodology oriented, like size, primate, type, study, analysis. The bottom words are too outliery, like humanosteology (as one word), concomitantly or ssxampdf.
After some trials and visual inspections I settled for thresholds 0.5 and 0.05. This means that the words to be included in text mining can occur in at most 50% of the articles, and at least 5%. In total xx words remained, the most and the least frequent words were these.
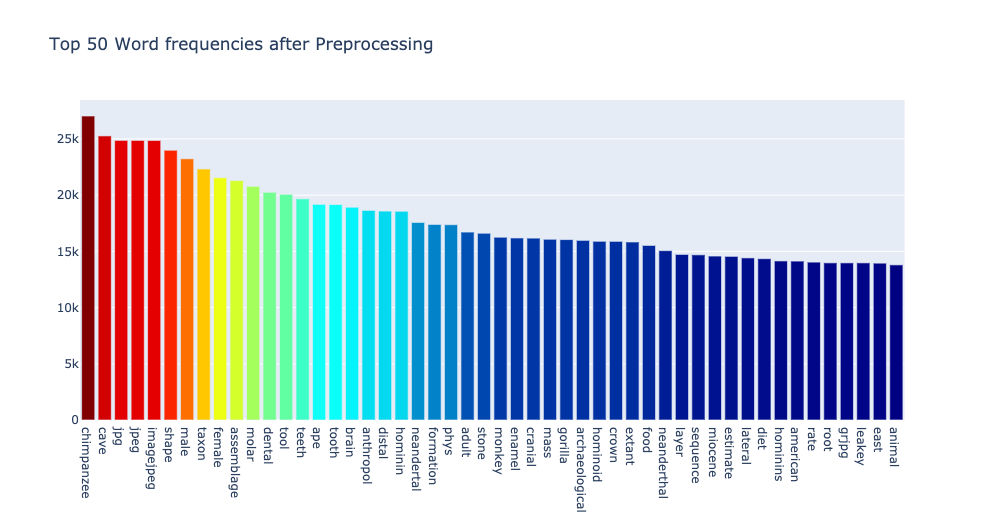
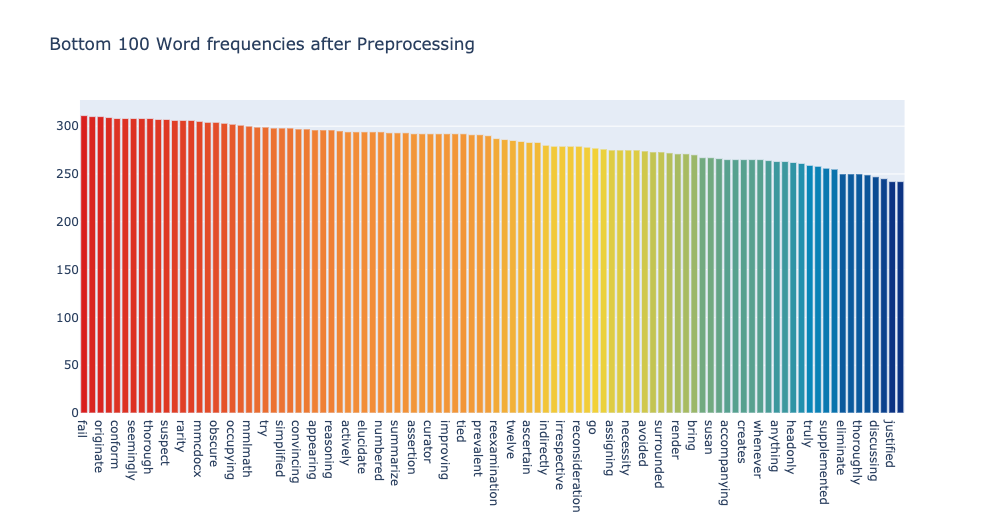
It’s still not ideal, for example, jpg and jpeg could be thought as irrelevant. But since they occur in less than half of the articles, they might as well be informative. For instance, they may be informative of topics that are visually intensive, such as those analyzing morphologies. Anyhow, one has to decide where to cut. One may also make a manual dictionary of words to be removed and go for higher thresholds overall. For this analysis settled with this setup.
Topic modeling
Topic modeling rose into popularity in early 2000s. It is a bit like clustering, but not quite. It captures thematic structure in document collections. Most often topic modeling is used for analyzing textual data, but it has been used elsewhere, for instance, for analyzing gene sequences. The latter came before text analysis, but text analysis made topic modeling widely popular. It has been used probably in zillions of applications from annotating text news to disambiguation of authorships of the Bible.
The basic topic model for text analysis is called Latent Dirichlet Allocation. The model assumes that there is a fixed number of topics to talk about. Each topic prioritizes certain words. The underlying vocabulary is common for all topics, but the frequencies of word usage are not. The topics are modeled as distributions of words, and the documents are modeled as distributions of topics. Fitting the model extracts a number of topics from the corpus and assigns each document to these topics. For example, a document can be assigned 80% to Topic#1, 11% to Topic#2 and 9% to Topic#3.
Naturally, if we ask for a large number of topics, they will be quite specialized, if we ask for a few topics, they will be generic. There are ways to assess model fit, but I did not use them here. I wanted relatively few number of topics such that I can analyze the trends, that is how the popularity of topics has changed over 50 years of operation of the Journal of Human Evolution.
I focused on the Journal of Human Evolution because it had a long history as one of the prime venues for publishing on human evolution, it has published only on human evolution (analyzing a generic journal like Nature, for instance, would carry an extra challenge how to filter out articles that are irrelevant for human evolution research) and also because it was technically easy to get full texts for analysis from Scopus.
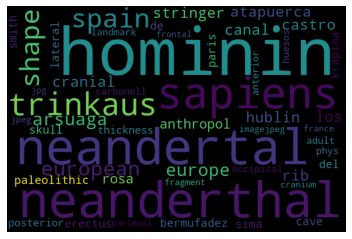
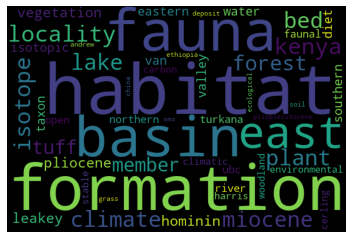
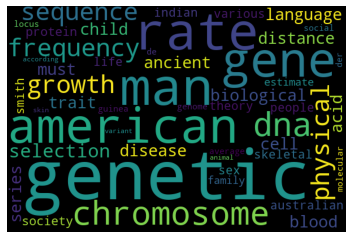
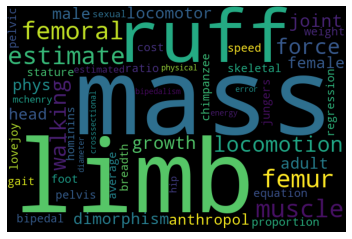
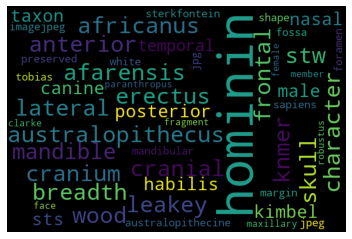
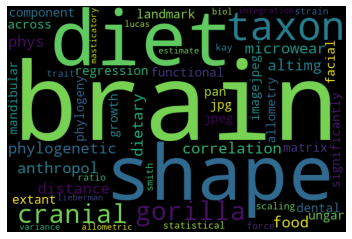
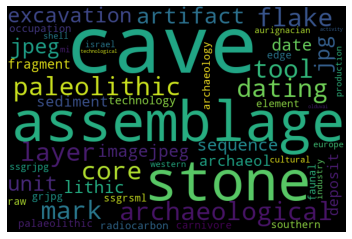
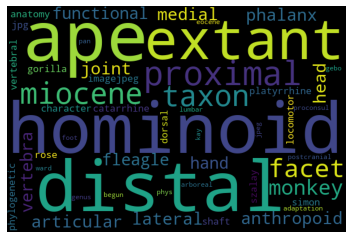
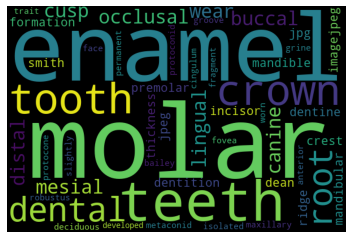
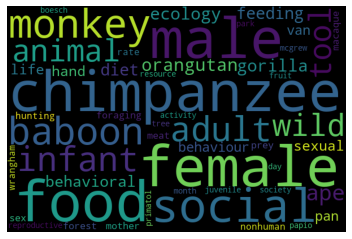
After some experimentation I settled on extracting 10 topics. The following topics came up (visualized using WordCloud for Python). The larger the word in the visualization, the more important is the word for the topic. The topics are manually named for easier referencing.
Topic#0: Neanderthals
Topic#1: Early human environments
Topic#2: Human genetics and genomics
Topic#3: Human locomotion
Topic#4: Hominin taxonomy
Topic#5: Hominin brains
Topic#6: Stone tools
Topic#7: Hominoid anatomy
Topic#8: Hominoid teeth
Topic#9: Hominoid behavior
Intuitively, the topics make sense and they are distinct. The major lines in human evolution research are captured.
Topics over time
Next, I looked how the prevalence of those topics in the journal changes over the years. For easier visual analysis I aggregated the results into 5 year bins. Analyzing year by year, or even issue by issue is possible, but the lines then are more jittery.
The visualization below is of the results averaged over all articles within each 5 year bin. The length of the articles is not taken into account, each article contributes equally to the average.
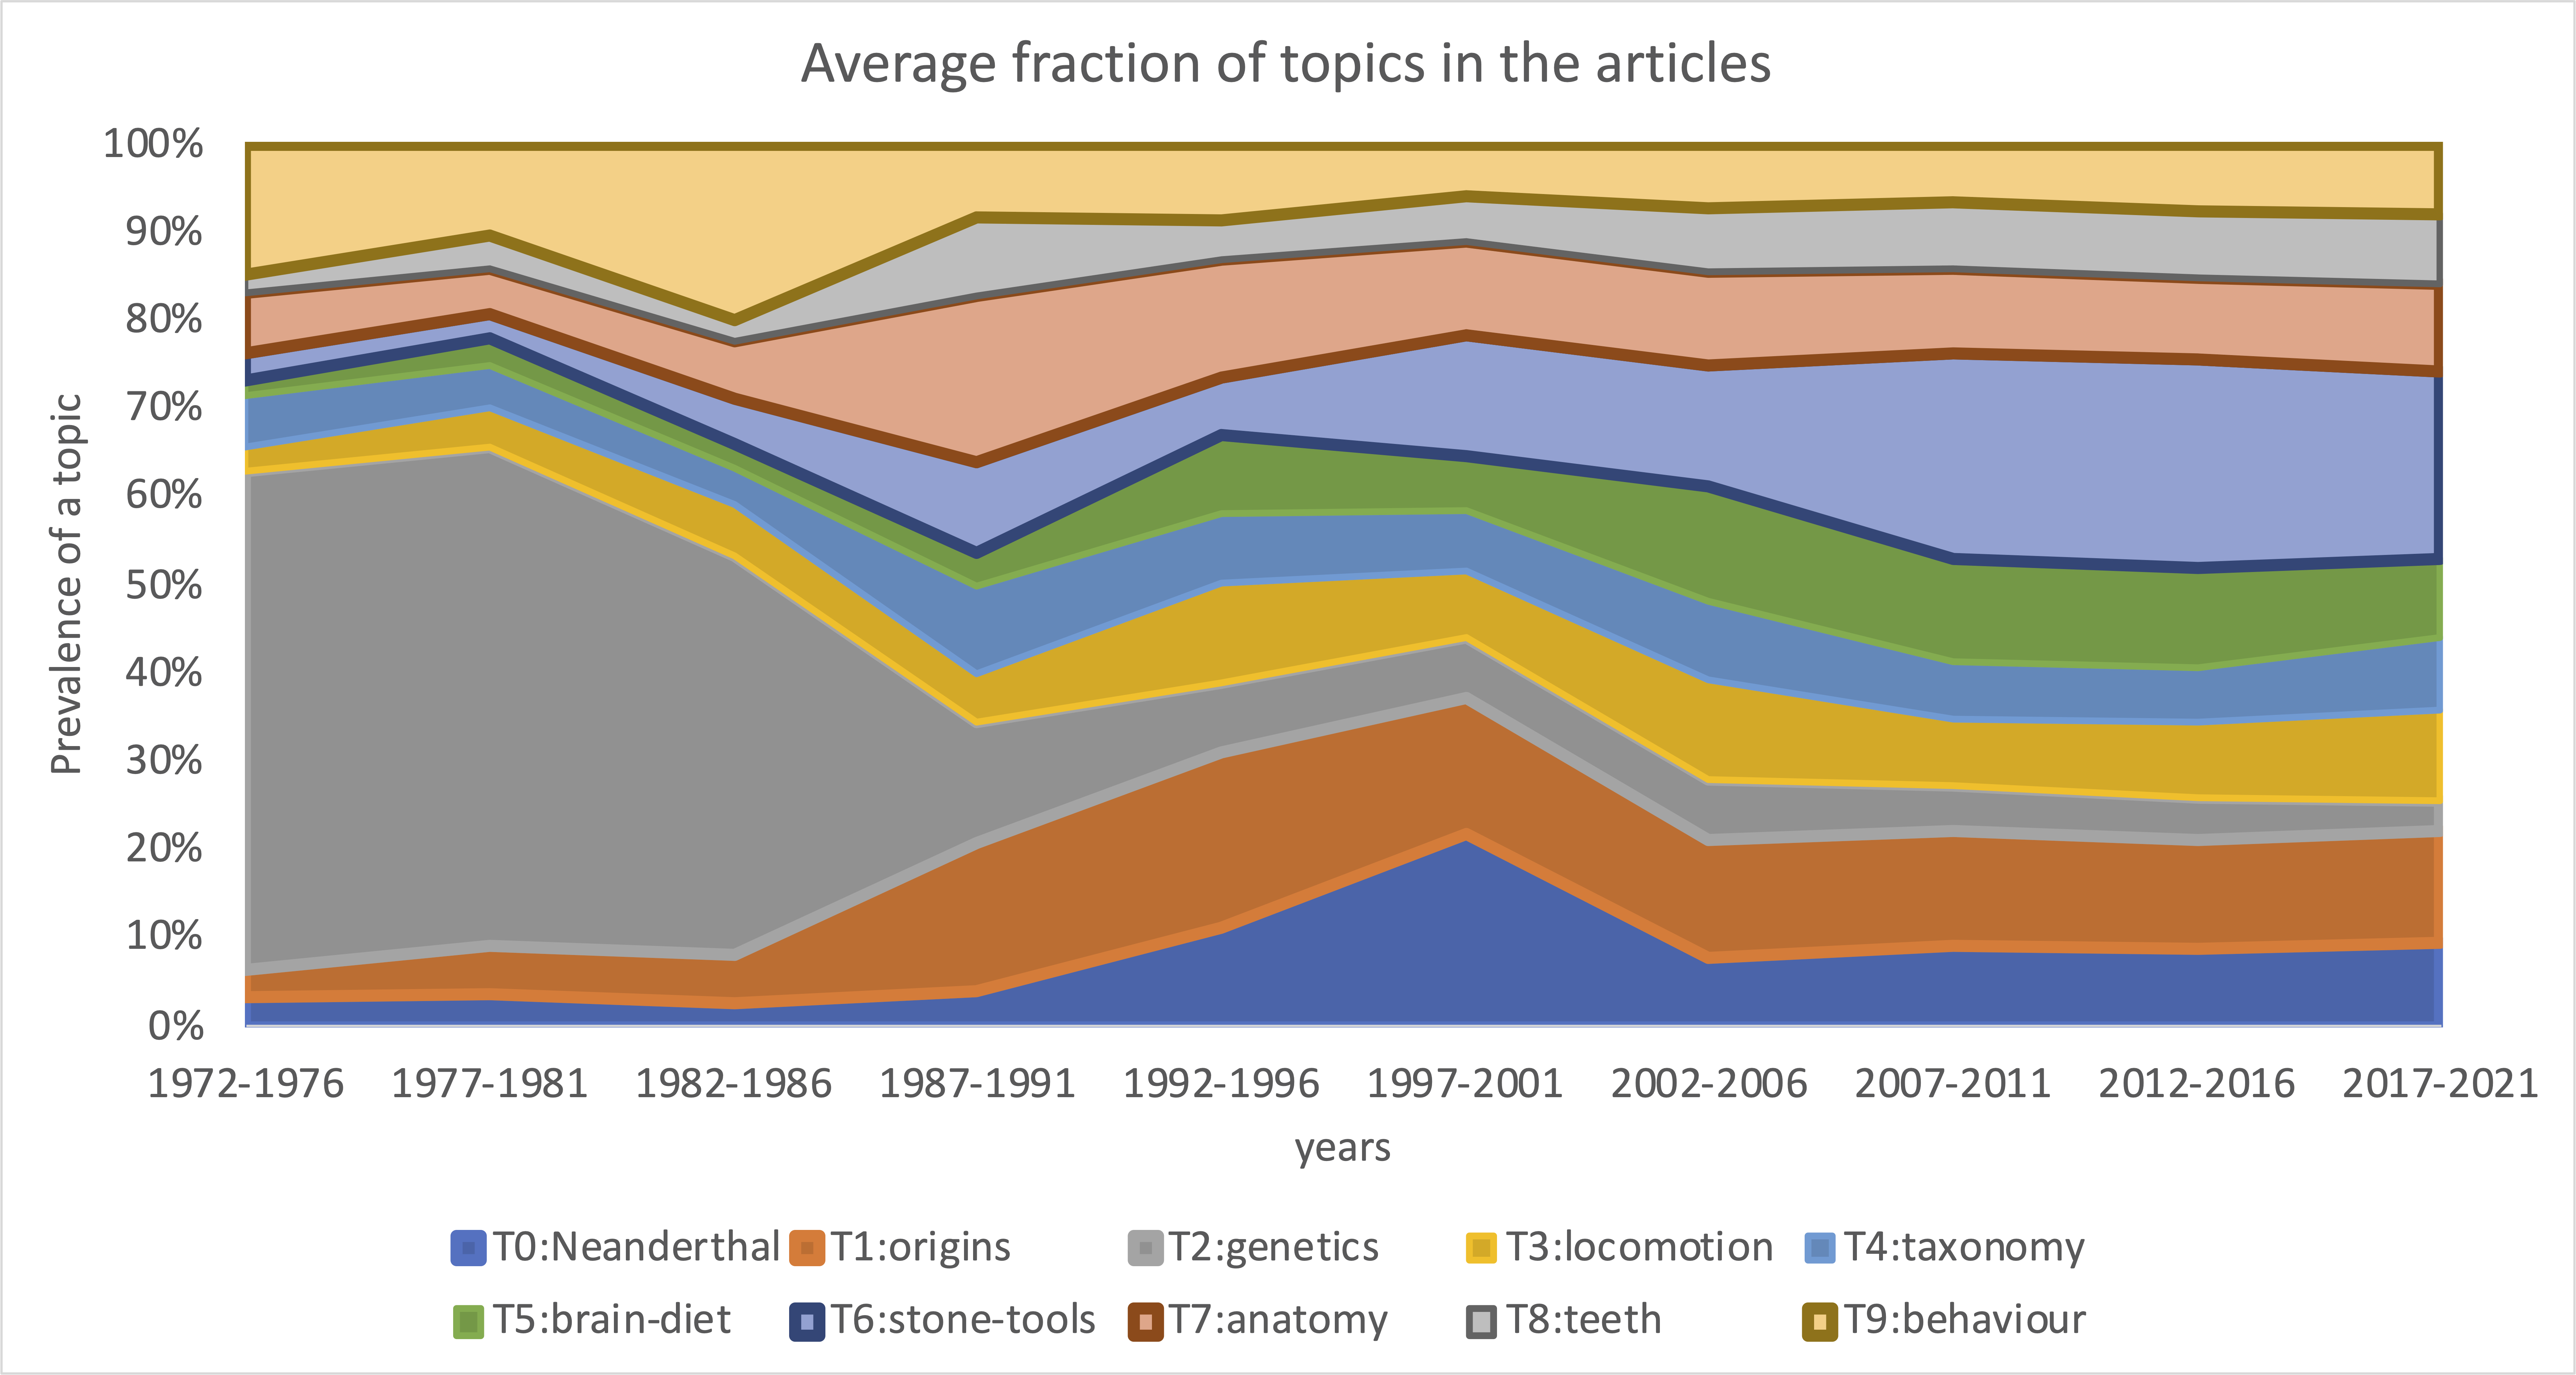
The major patterns we see are the decline of the share of locomotion and genetics, a peak in the Neanderthal topic around 2001 and increase prevalence of tone-tool and brain related topics.
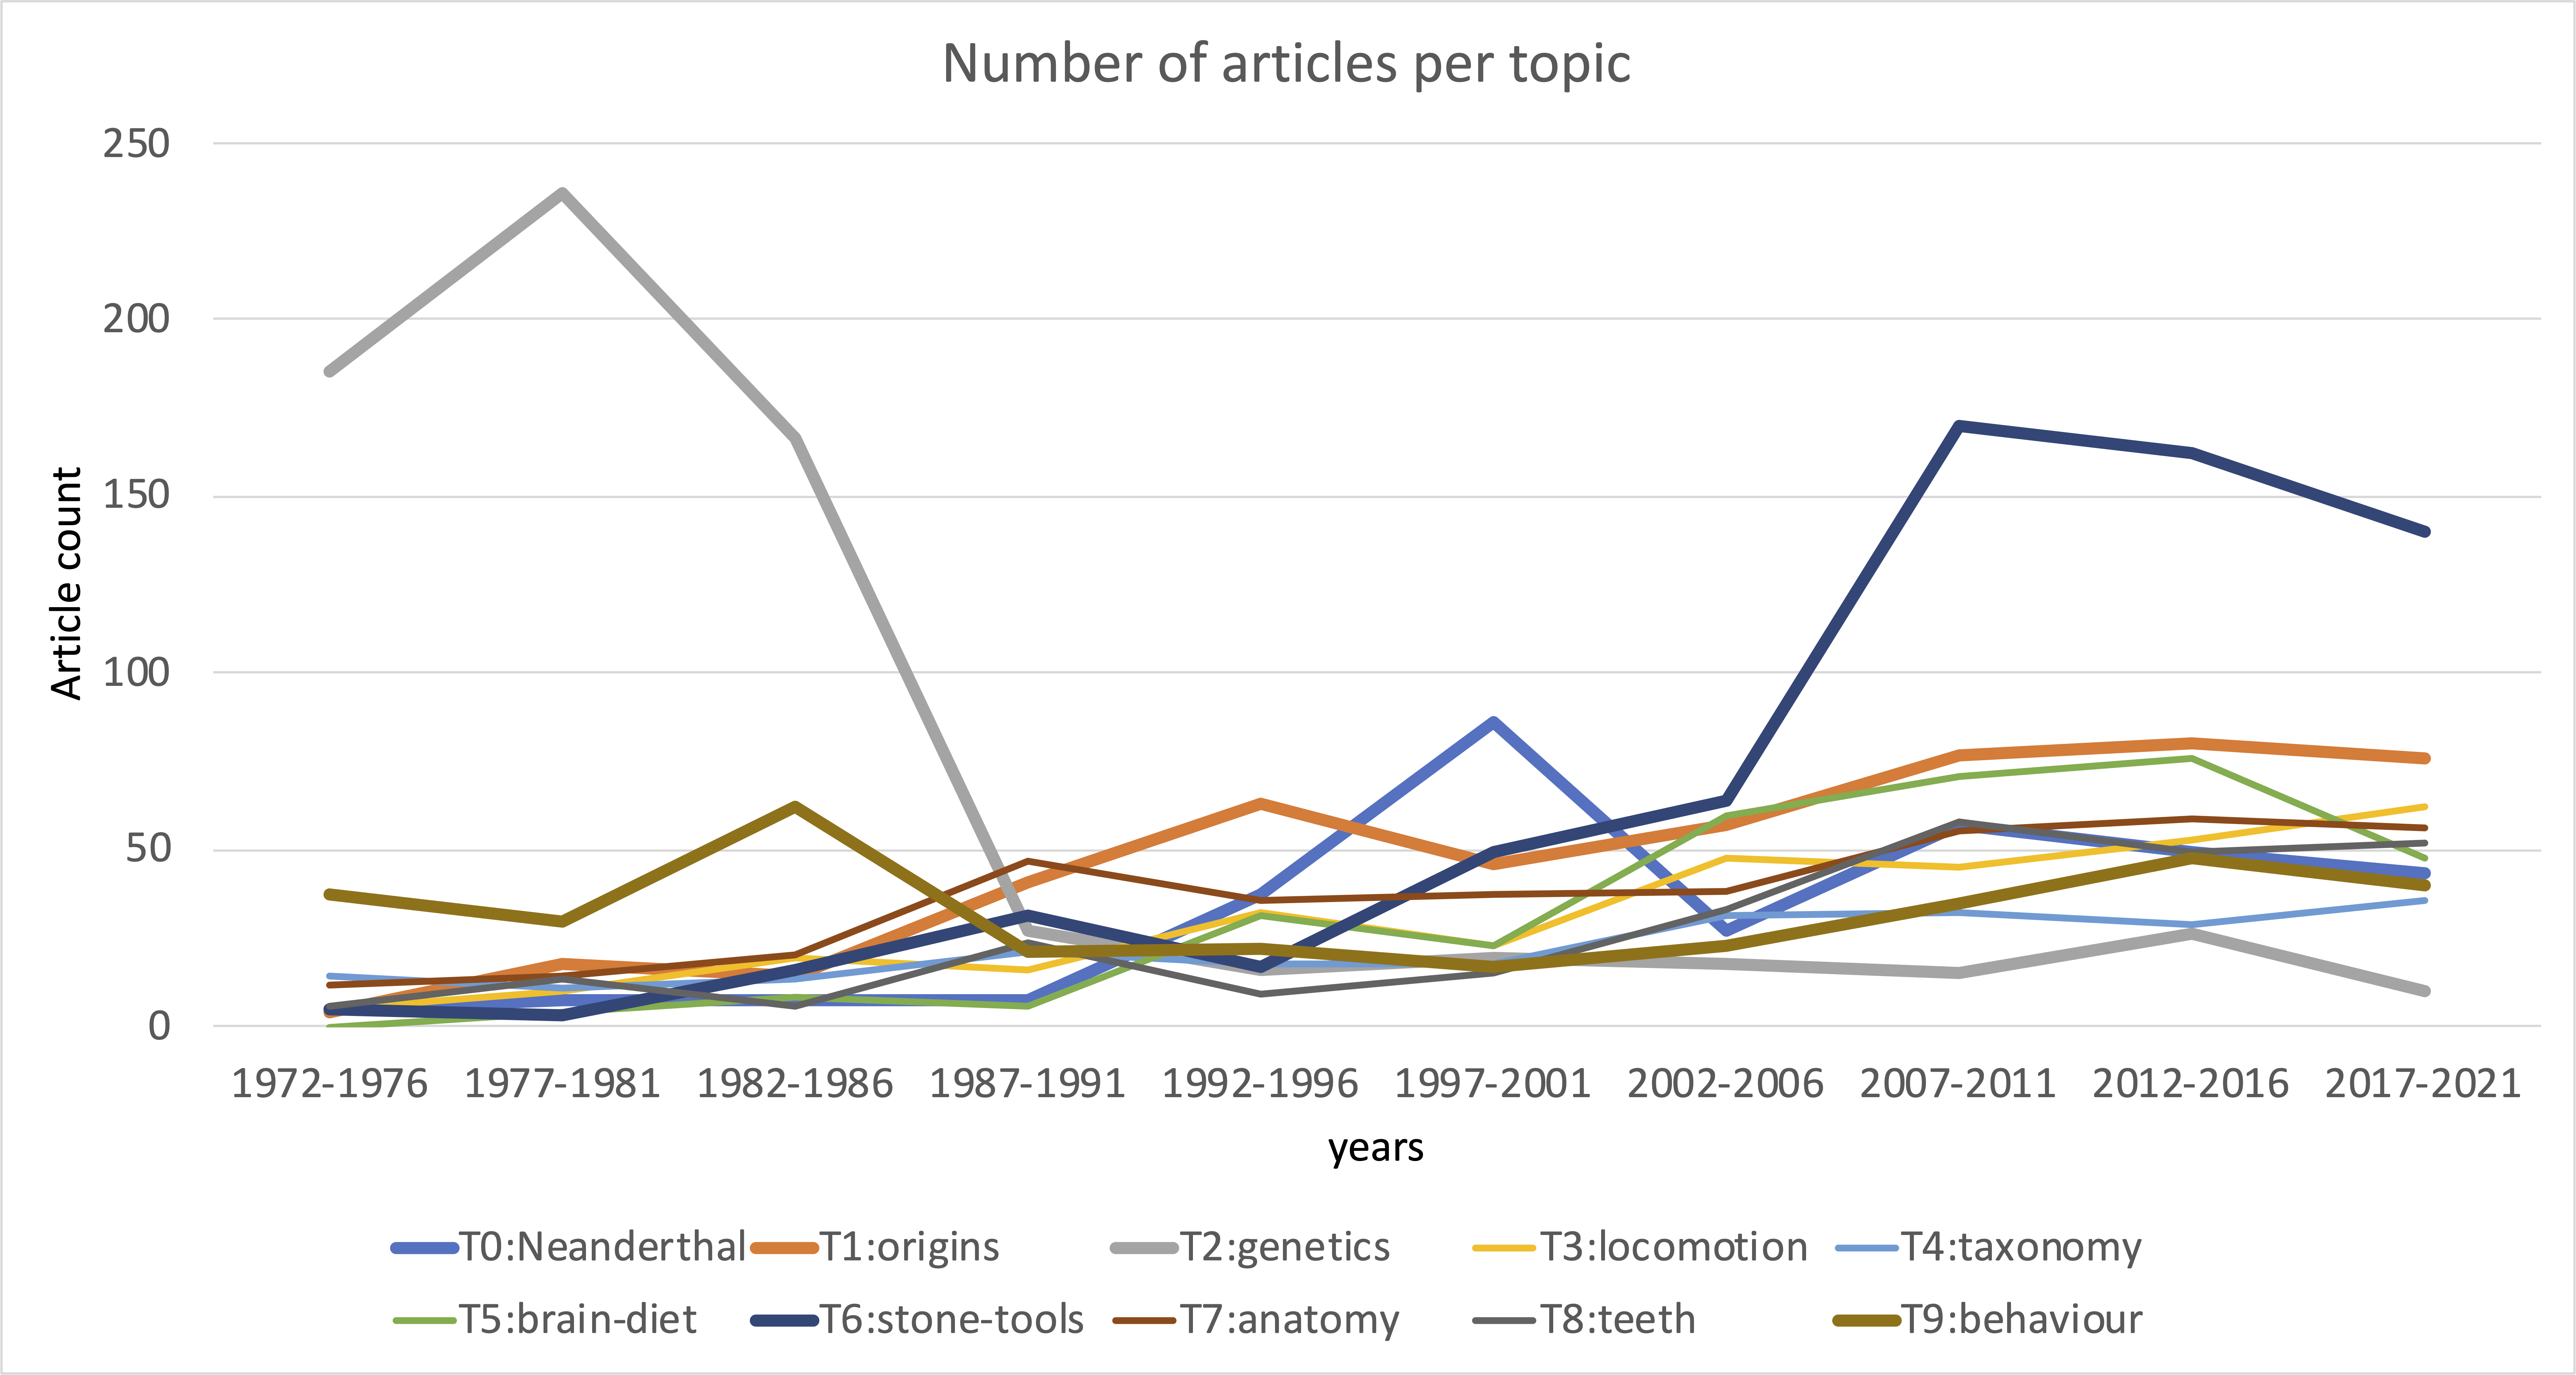
Overall, there is an upward trend in the number of articles published per year, but the main patterns remain even if visualized by the number of articles per year rather than the fraction of topics. In this visualization each article is assigned to one topic that has the largest estimated share within that article.
Sentiment analysis
Lastly, I did sentiment analysis of the articles. I was curious whether the sentiments towards the topics that are in decline over time get more negative as the topic declines. Overall, this does not seem to be the case. While some topics generally carry more negative sentiments than others, it looks like all topics follow very similar trends in sentiments over the years. Perhaps, this reflect the overall editor effort rather than attitudes towards particular topics.
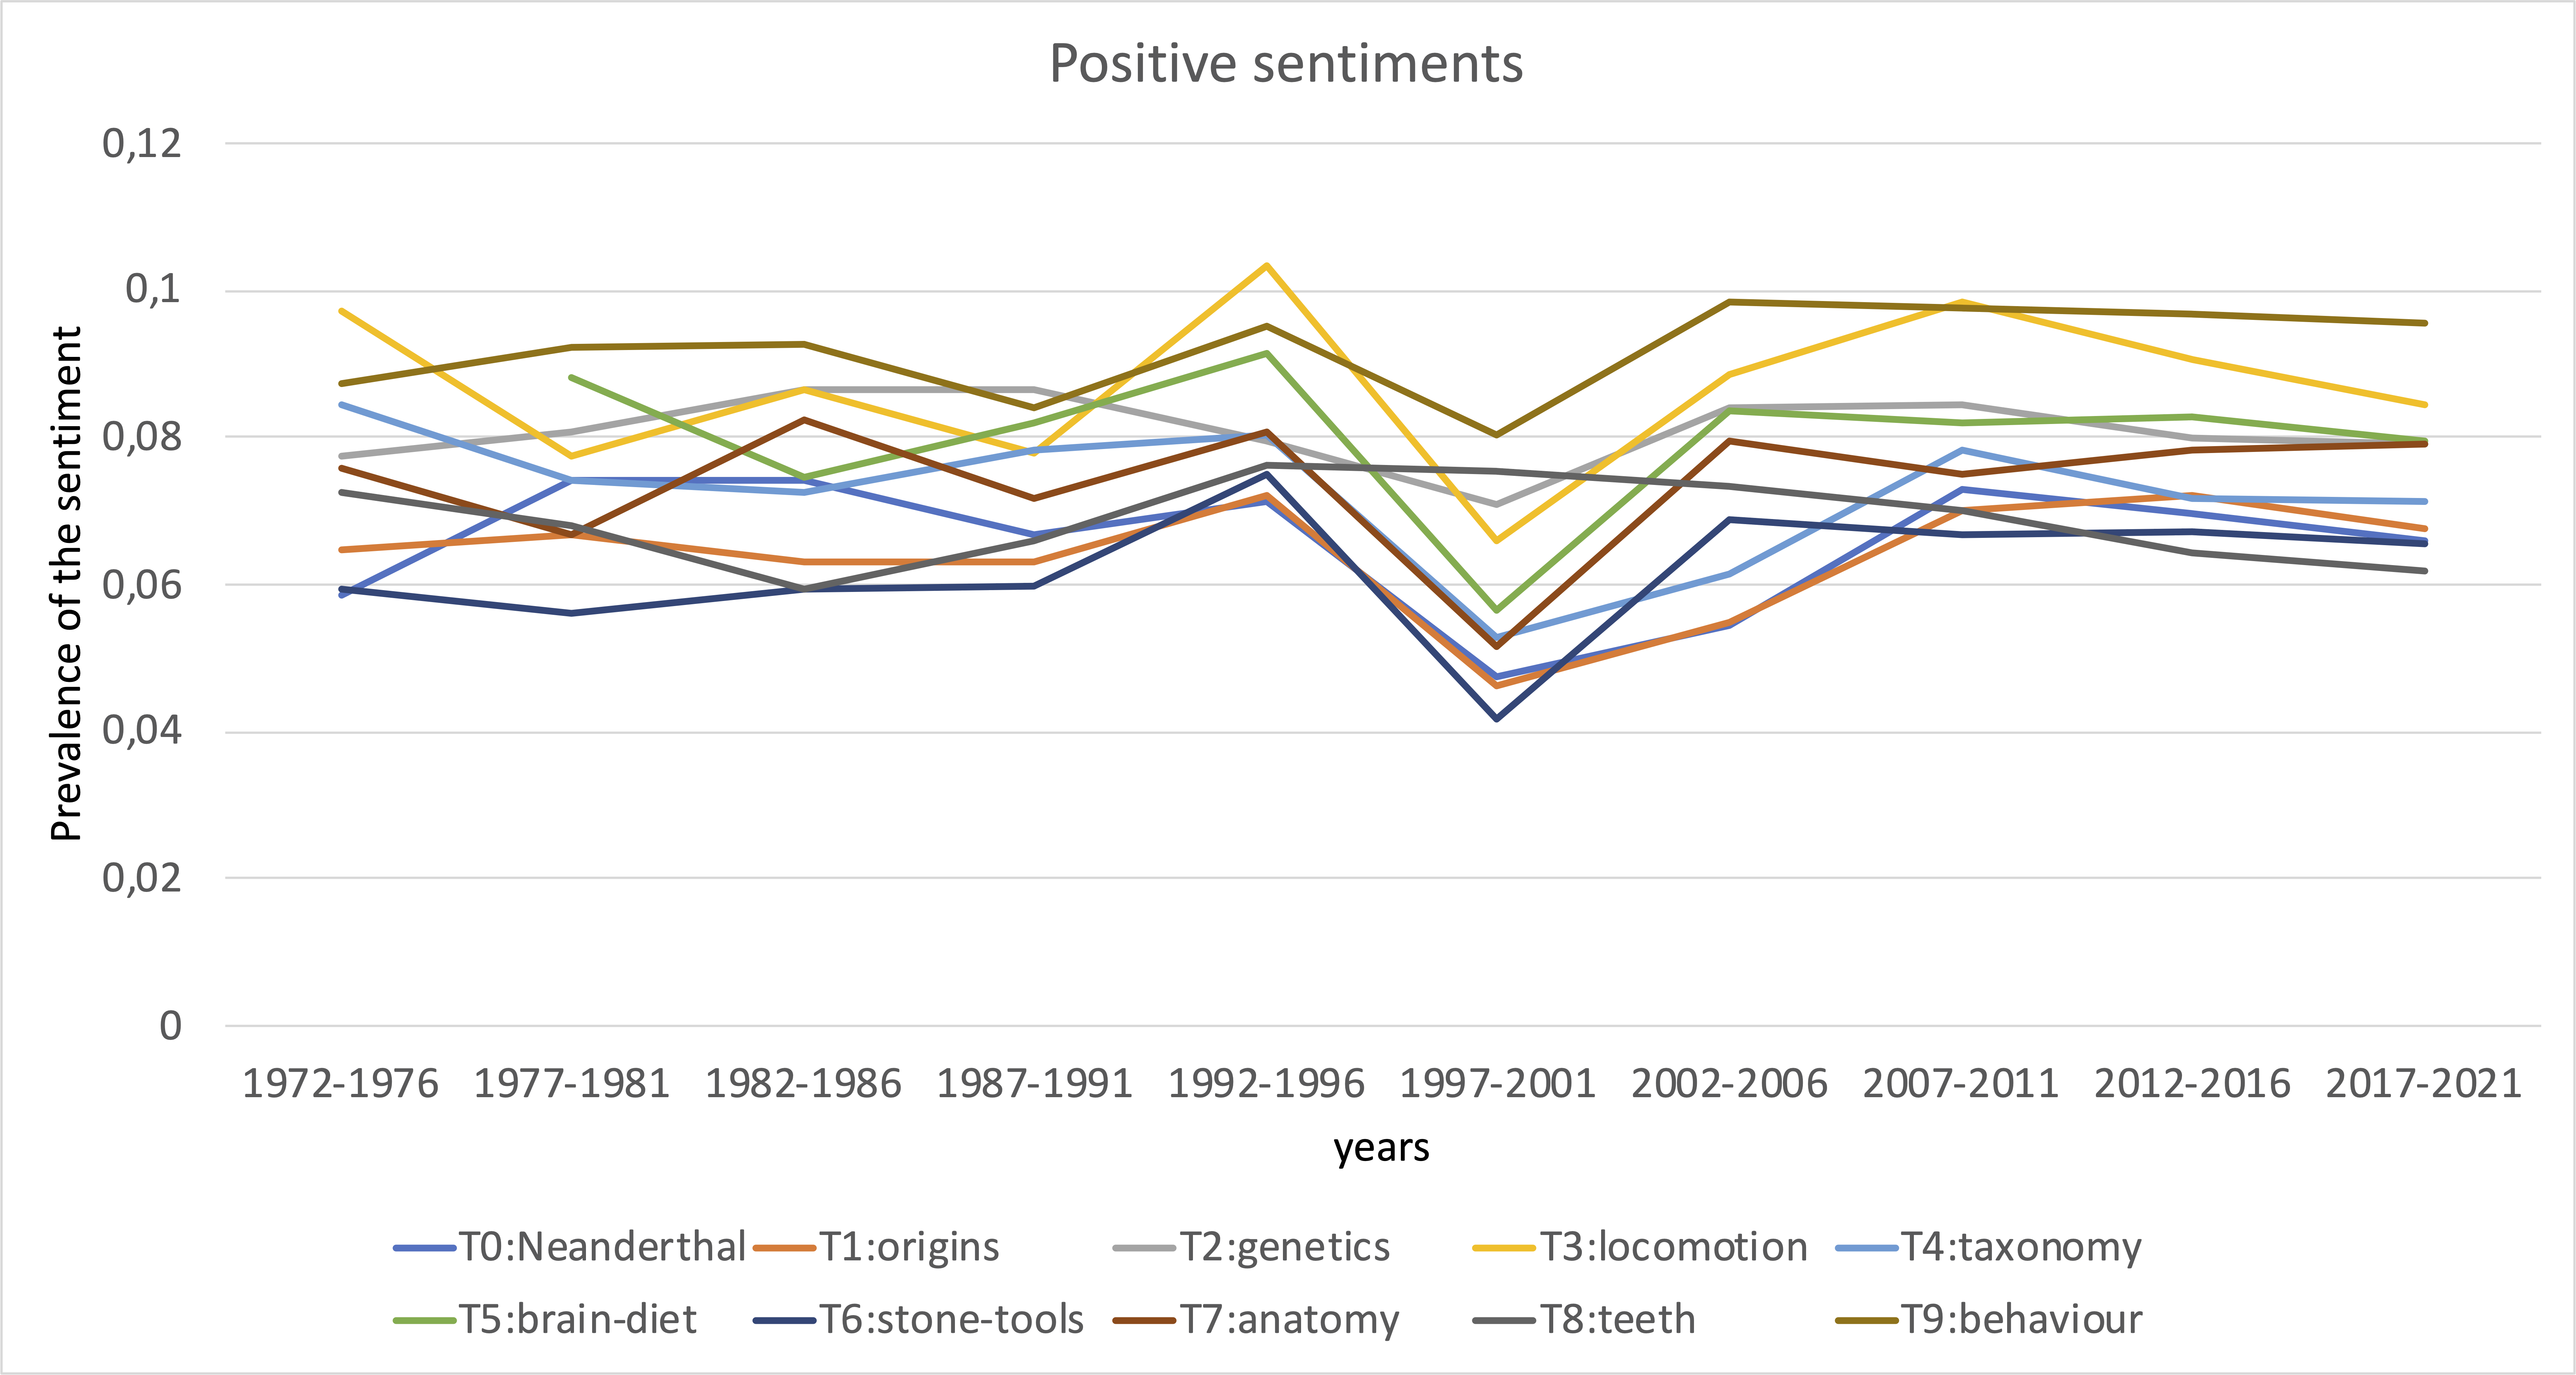
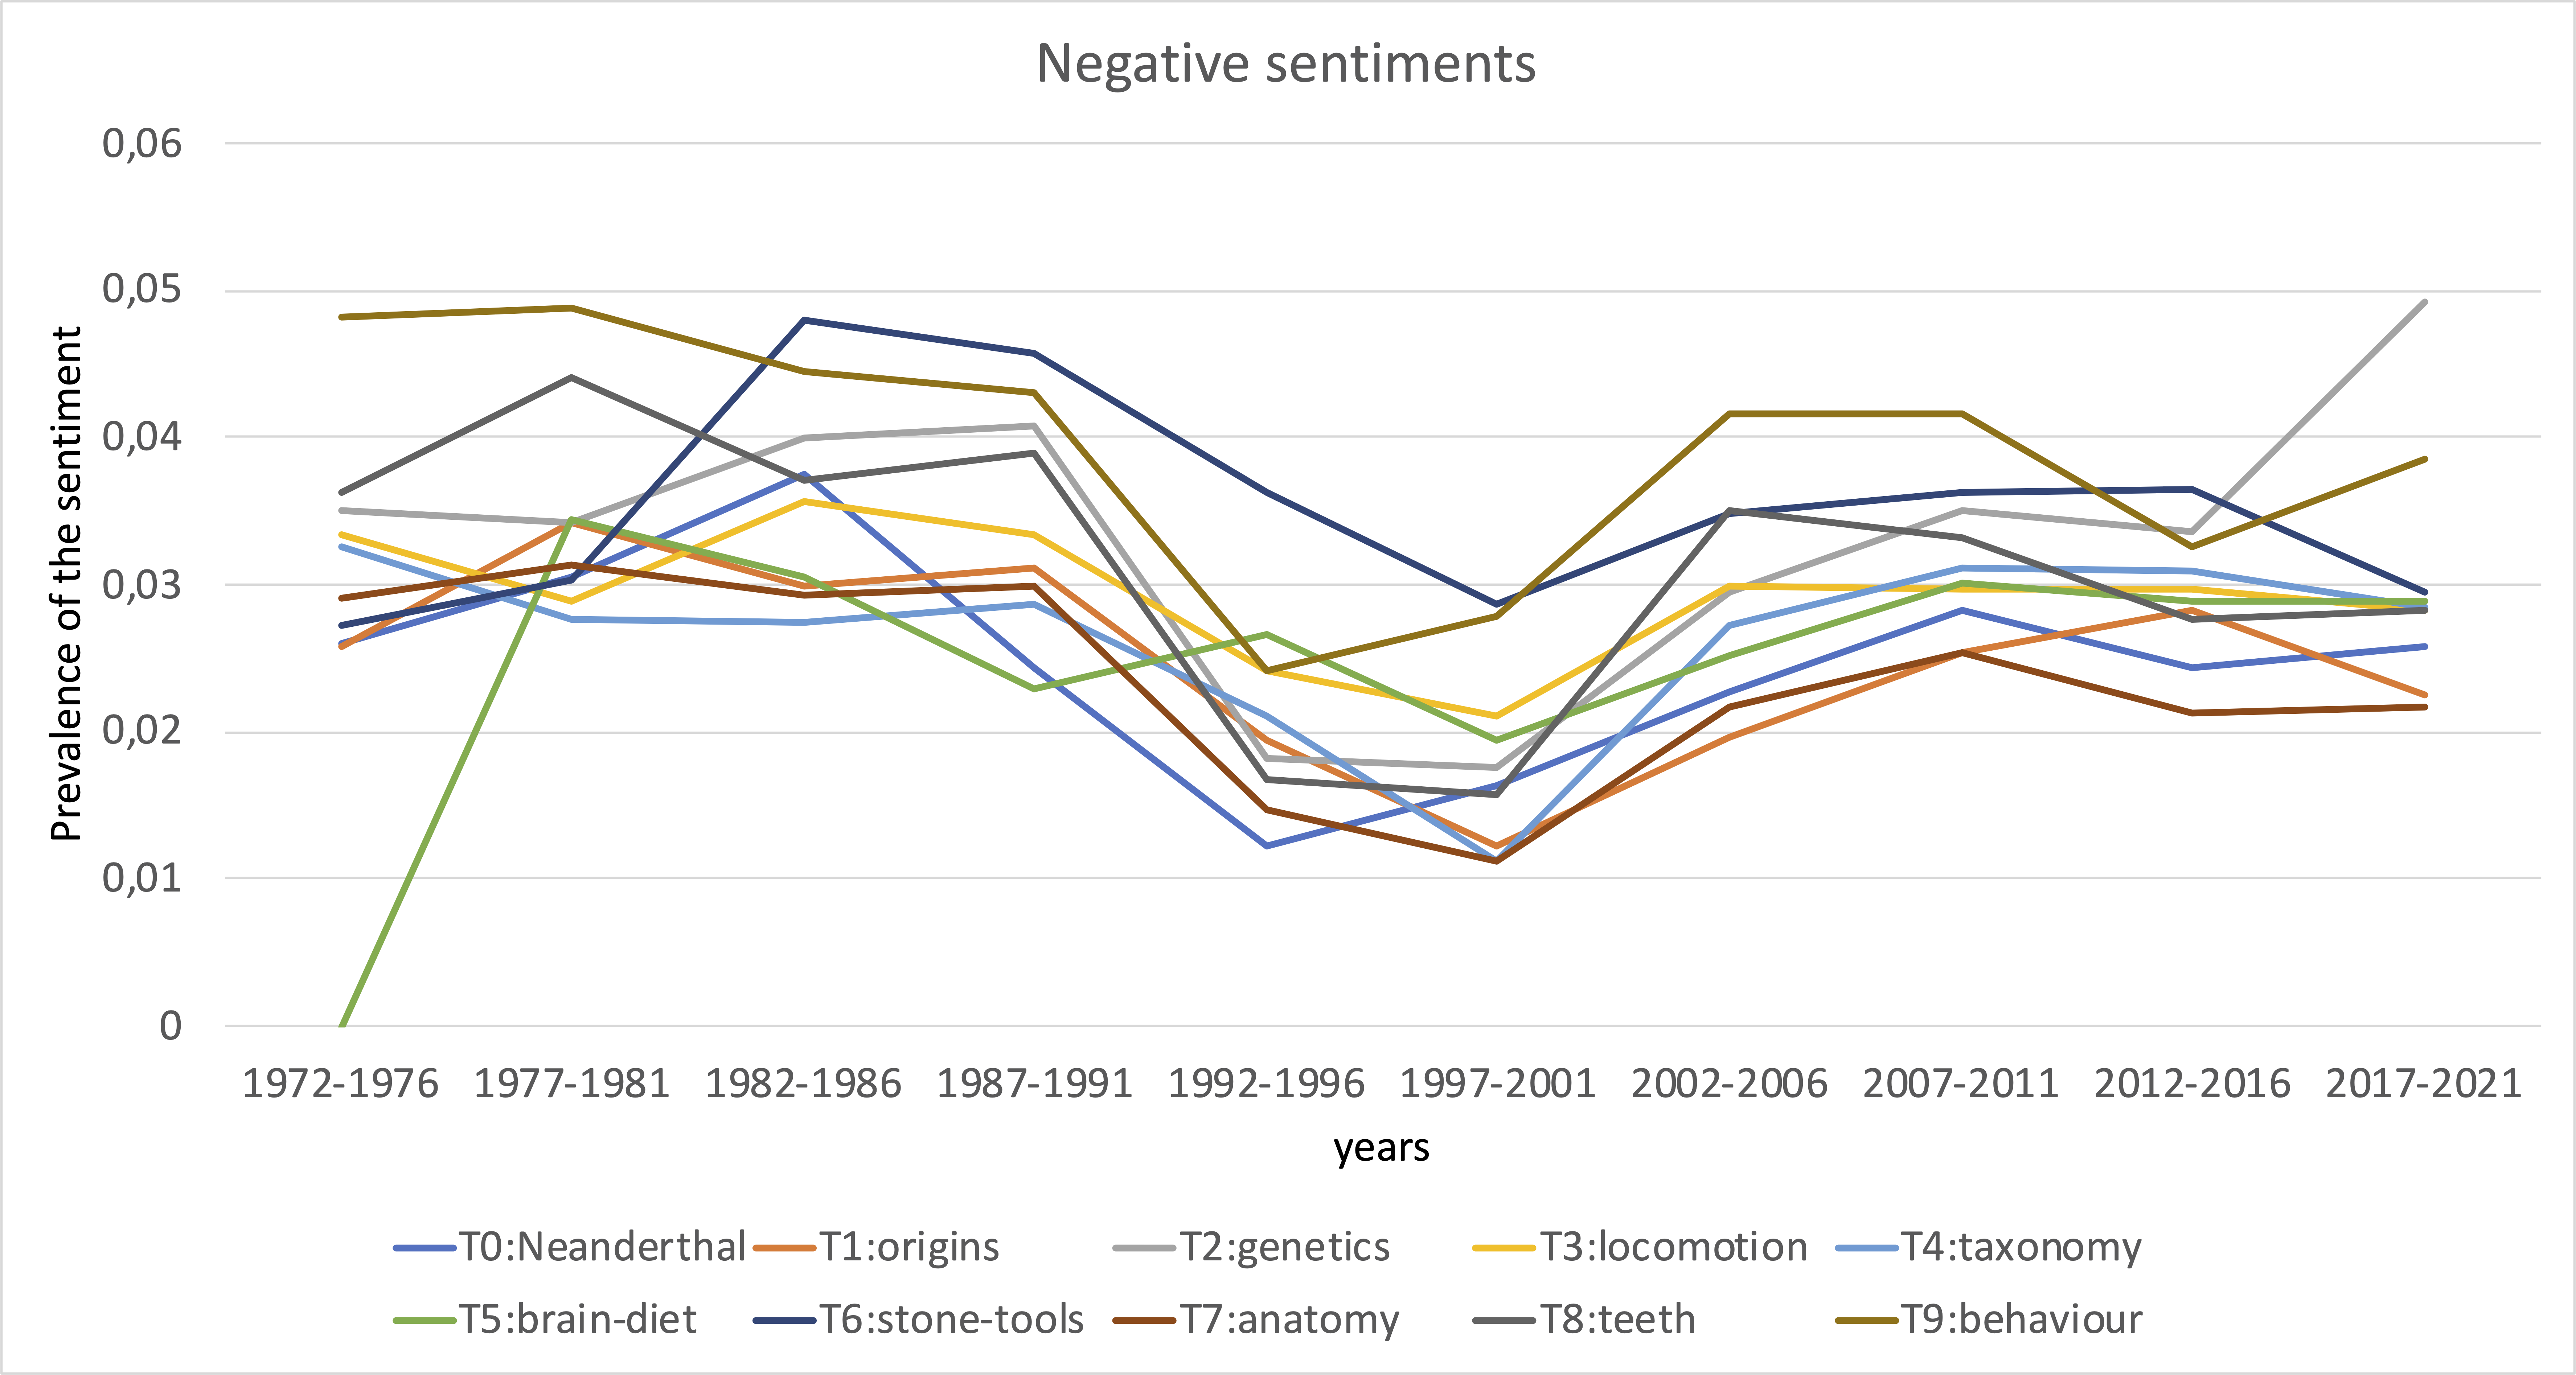
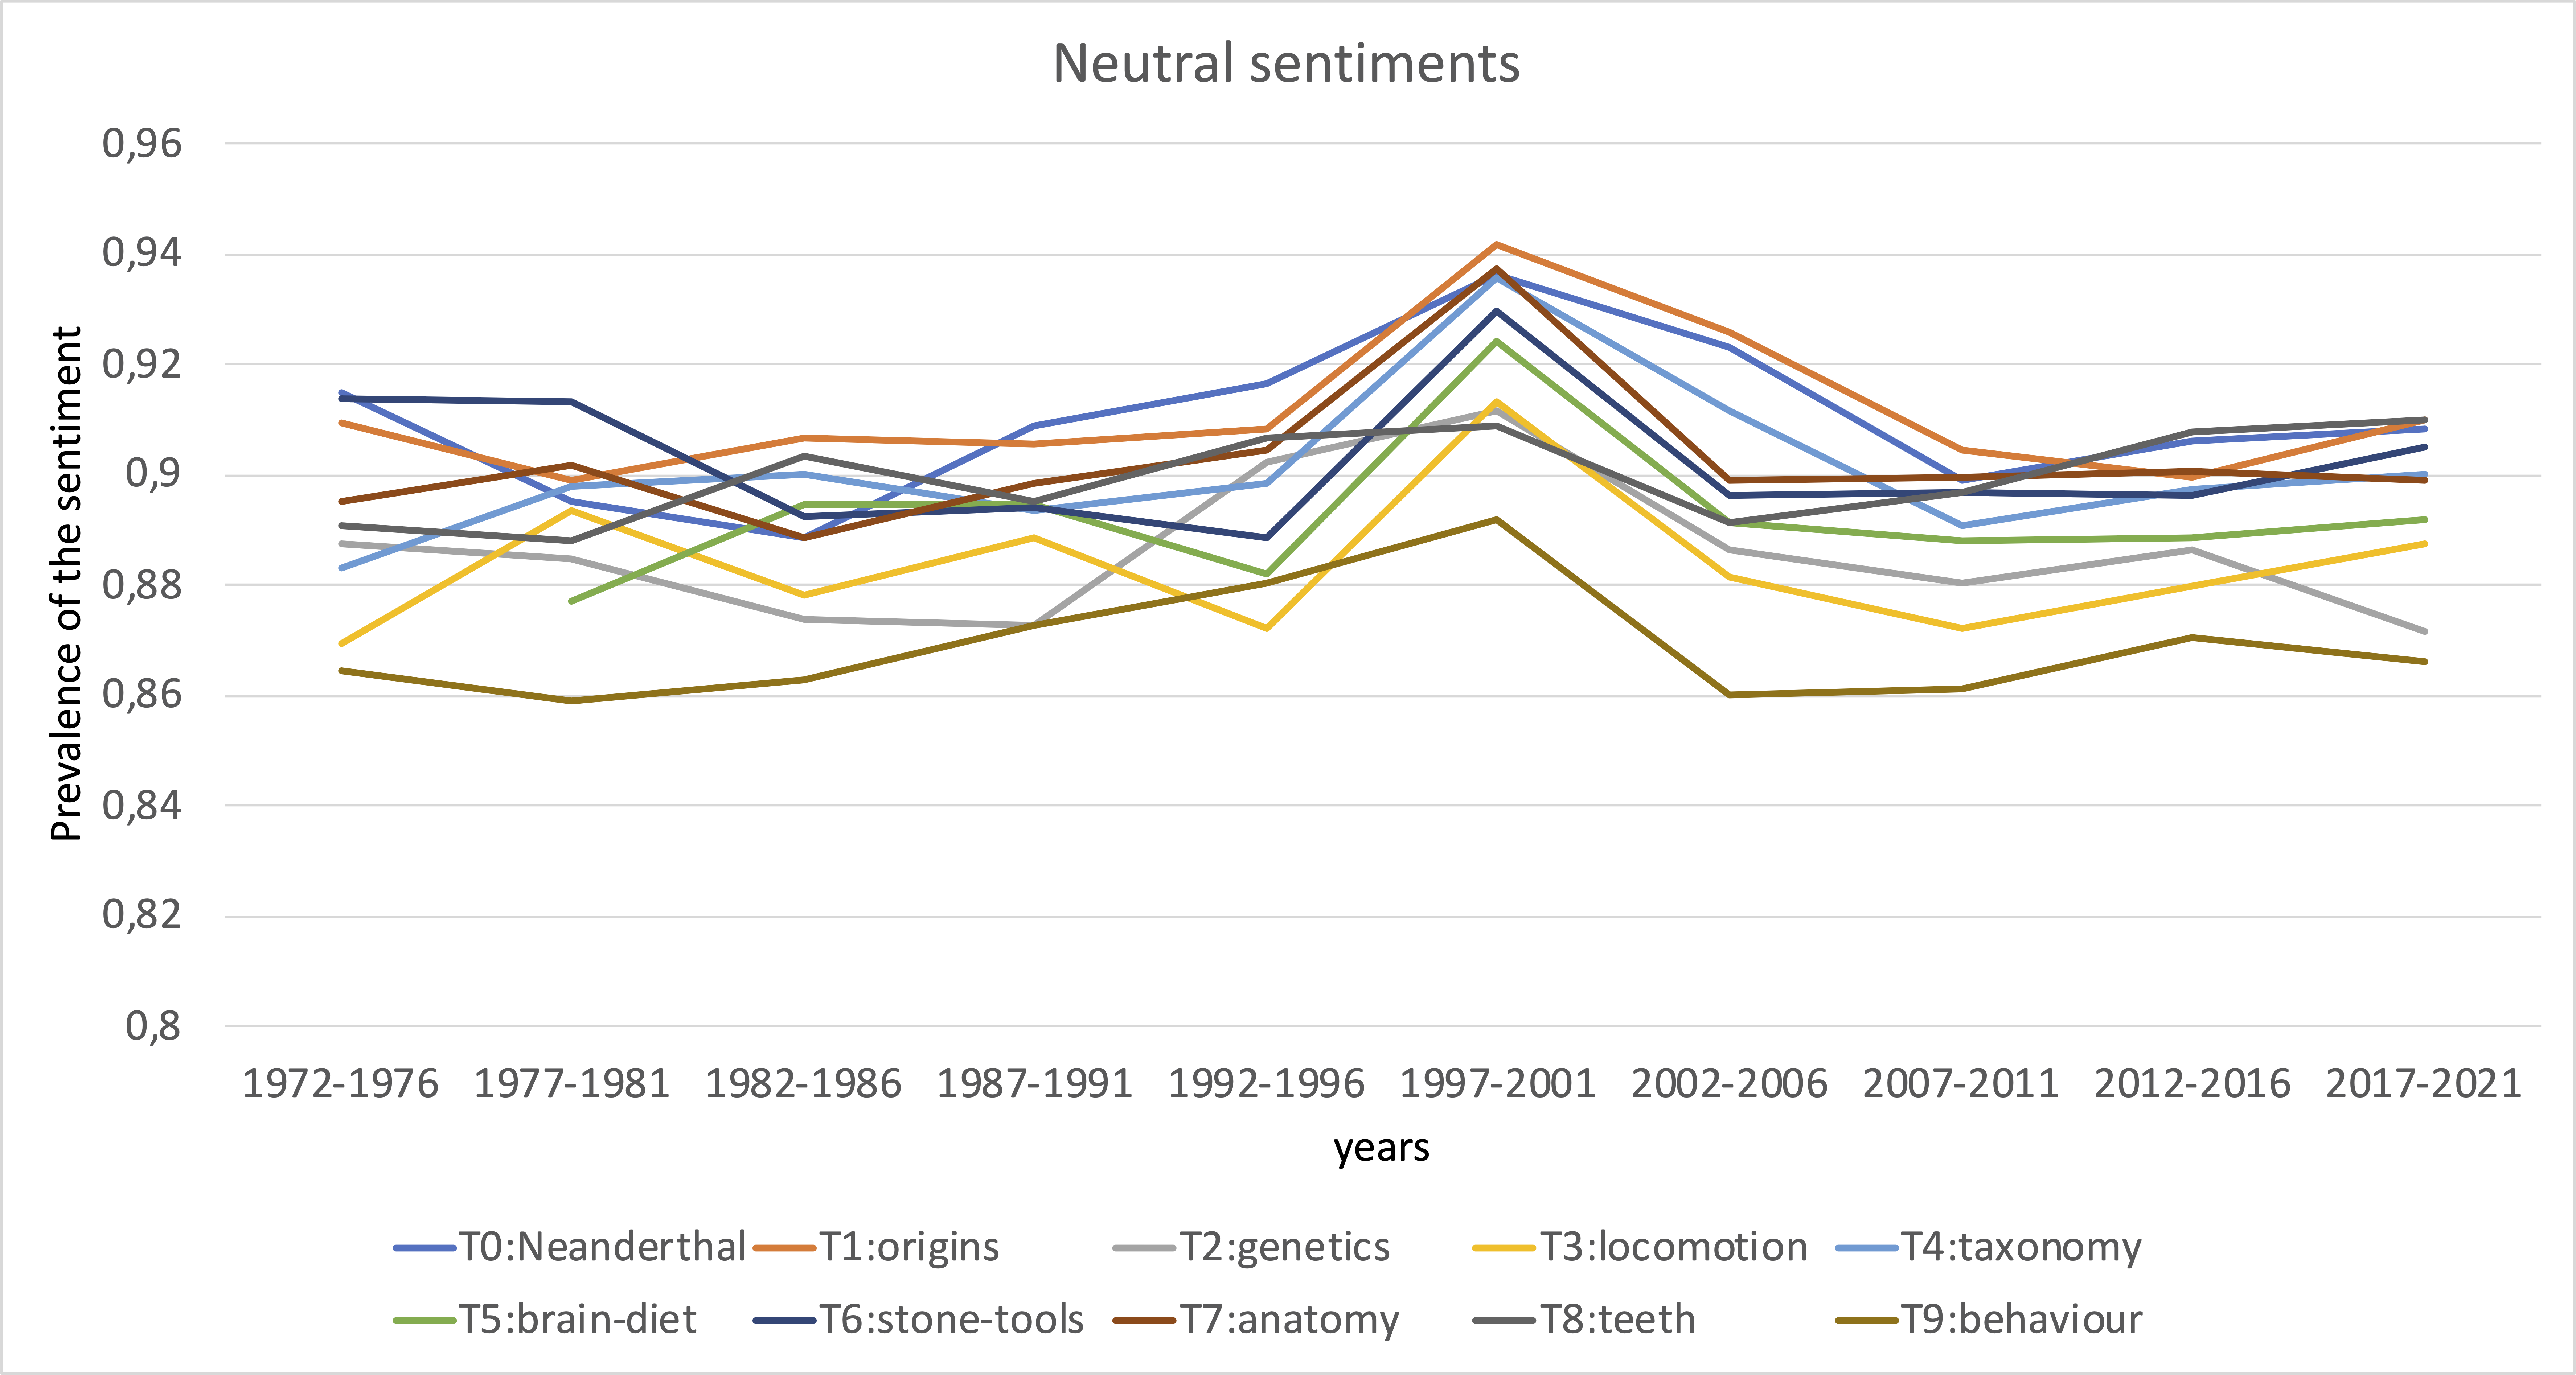
Peculiar patterns appear around 1992-2001. First positive sentiments increase across most of the topics, then positive sentiments decrease and neutral sentiments increase.
On average about 80-90% of content is classified as neutral. The remainder carries either positive or negative sentiments. Sentiments can be negative due to critique to research, but more often negative sentiments are due to the content being described, so by and large this sentiment analysis does not reveal changes in attitudes towards research topics.
For illustration, three articles that come with the highest negative sentiment score are:
- “High adult mortality among Hiwi hunter-gatherers: Implications for human evolution”;
- “Risk and opportunity for humans coexisting with large carnivores”;
- “The relationship between patterns of incorrect responses and enhanced discrimination-reversal learning in rhesus monkeys (Macaca mulatta)”.
Three articles that come with the highest positive sentiment score are:
- “The learning skills of great apes”;
- “The anatomy of primatology”;
- “Hand specialization, sympatry, and mixed-species associations in callitrichines”.
I used a pre-trained sentiment classifier that was primarily built for classifying Tweets. Tweets are generally shorter and more often than not use colloquial language. Some of the peculiar results may be due to that.
That’s all for now. Drop me an e-mail if you have any comments, I’m always curious.