Measuring similarity between sets in paleontological analysis
Symmetric similarity measures
One big topic in paleontological data analysis is comparing similarities of sets of species found in different geographic areas and coming from different times. A set of species, for example, is {wolf, rabbit, reindeer}. For measuring similarity, standard and specifically developed indices are used, the most popular of which are: Dice, Jaccard, Simpson, Raup-Crick.
Suppose we have two sets A and B. Jaccard index is computed as
\(\frac{size(A \cap B)}{size(A \cup B)}\).
Dice is computed as
\(\frac{2 size(A \cap B)}{size(A) + size(B)}\).
Dice is the same as F1 score in information retrieval.
Simpson index is computed as
\(\frac{size(A \cap B)}{min(size(A),size(B))}\).
Raup-Crick index is computed using a randomisation procedure and is based on the probability of observing at least \(size(A \cap B)\) shared species in the compared communities.
More details are available in the PAST manual, which is a software for paleontological data analysis.
Anyway, those similarity measures are symmetric. Similarity of a site of interest to the reference site is the same as similarity of the reference site to the site of interest. This is useful, for instance, if the goal is to analyse overall distribution of species in some areas.
Comparing to a prototype
Often the goal is to compare species occurrence to specific reference sites. That is, researchers may be interested in how species from the reference sites are reflected in other sites. Since other sites may have different amounts of extra species, which will show as deviations in the standard (symmetric) similarity measures, commonly used measures are not the most informative for this purpose.
Thus, for measuring asymmetric similarity the Tversky index [1] can be used. It compares a variant to a prototype. The Tversky index is computed as
\(\frac{size(A \cap B)}{size(A \cap B) + size(A - B)\alpha+ size(B - A)\beta}\),
where \(size(A - B)\) is the number of species in A, but not in B, and \(\alpha,\beta \geq 0\) are user defined weights.
Interestingly, the Tversky index is a generalisation of Dice and Jaccard coefficients, where setting the weights to \(\alpha=\beta=0.5\) gives Dice, and \(\alpha=\beta=1\) gives Jaccard.
Suppose A is the reference site, and B is a new site. Then Tversky index for comparing to the reference site uses \(\alpha=0.5\) and \(\beta=0\), which means that the measure is similar to Dice, except that the extra species on the new sites are not included. This serves the purpose to focus on comparison to prototype sites.
[1] Tversky, Amos (1977). Features of Similarity. Psychological Reviews 84 (4): 327–352.
Taking into account absence
All the indexes above, except for Raup-Crick, are based only on observed presence, but not on absence. That is, species that are present in neither, but possible, are not considered.
Possible measures to take into account absence in palaeontology are based on Forbes index [2]
\(\frac{size(A \cap B)size(C)}{size(A)size(B)}\),
where C is a set of all species, including species in A, species in B, and species in neither A and B. Forbex index can go above 1.
In principle, classification accuracy measures could be used to capture absence. For example, the Kappa statistic.
[2] Alroy, John (2015). A new twist on a very old binary similarity coefficient. Ecology 96:575–586.
Performance
I did a simulation to check how all these symmetric measures (no Tversky) perform. There is a base model where \(size(A) = 200x\), \(size(B) = 200x\), \(size(C) = 400x\), \(size(A \cap B) = 100x\), \(x = 1\), and for each test some assumption is relaxed. Here is my code in R.
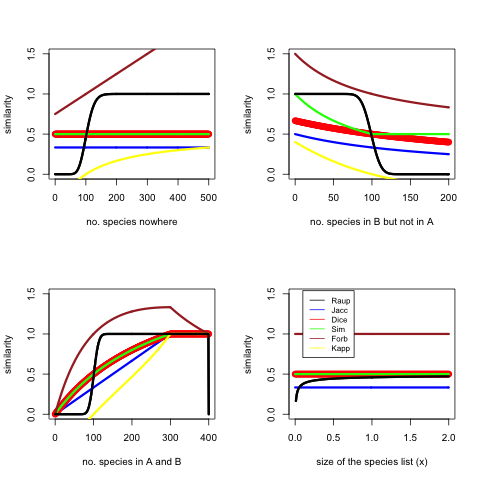
The figure shows that the sensitive area of Raup-Crick is very narrow, it basically acts as a classifier saying similar or not similar. Forbes sometimes goes off the chart. Kappa goes negative in cases the overlap is less than would be expected at random. Dice, Simpson and Jaccard act consistently and similarly. I would perhaps use Dice in many cases. Dice is the same as F1.